
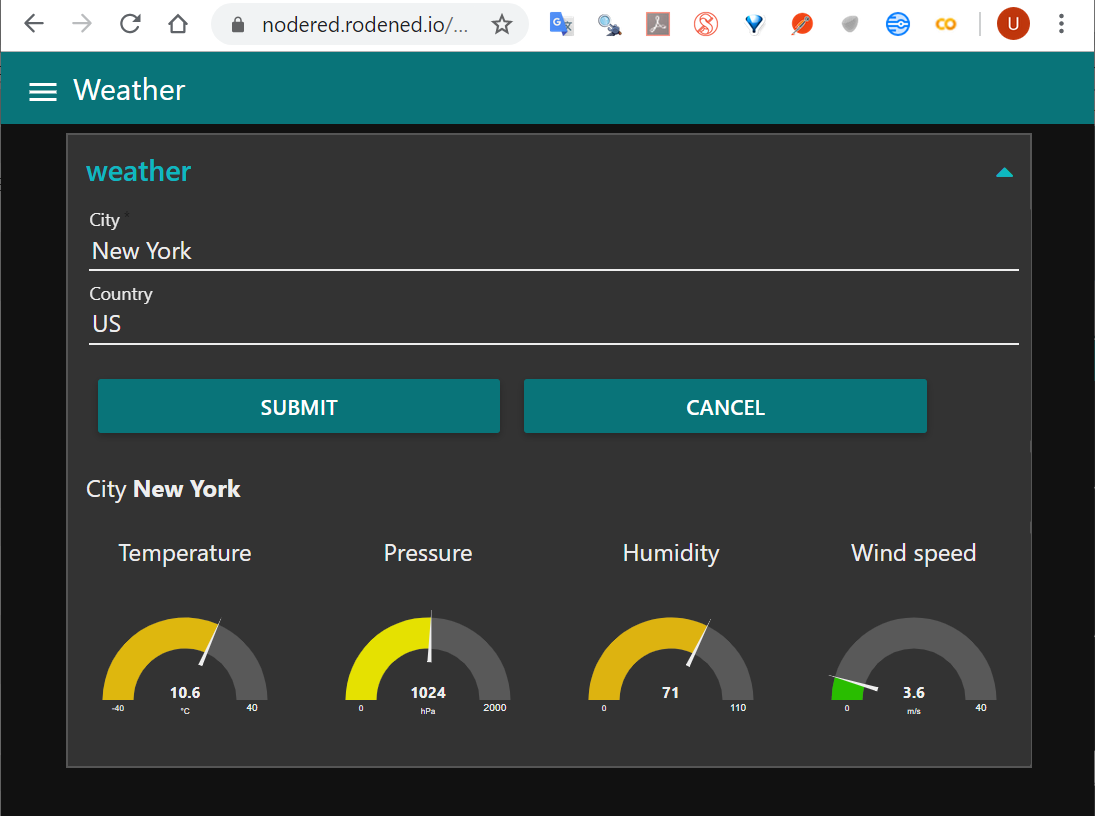
In this flow we will create a dashboard with a submit form and gauges that will present temperature, pressure, humidity and wind speed collected from a service API at https://openweathermap.org
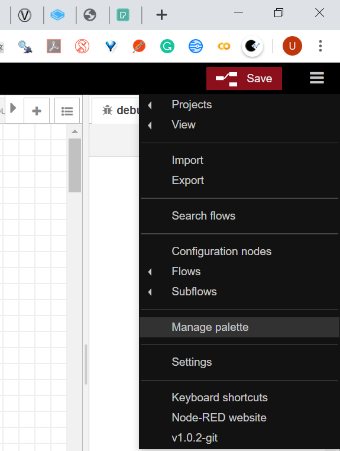
We start with importing the dashboard nodes. Click on the menu to the right of the Save button and select Manage palette.
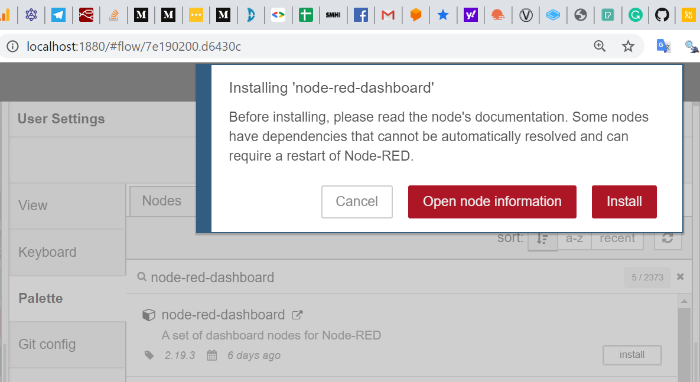
When the manage palette is opened select the Install tab and in the search window write node-red-dashboard and select install.

Click install on the pop up window also.
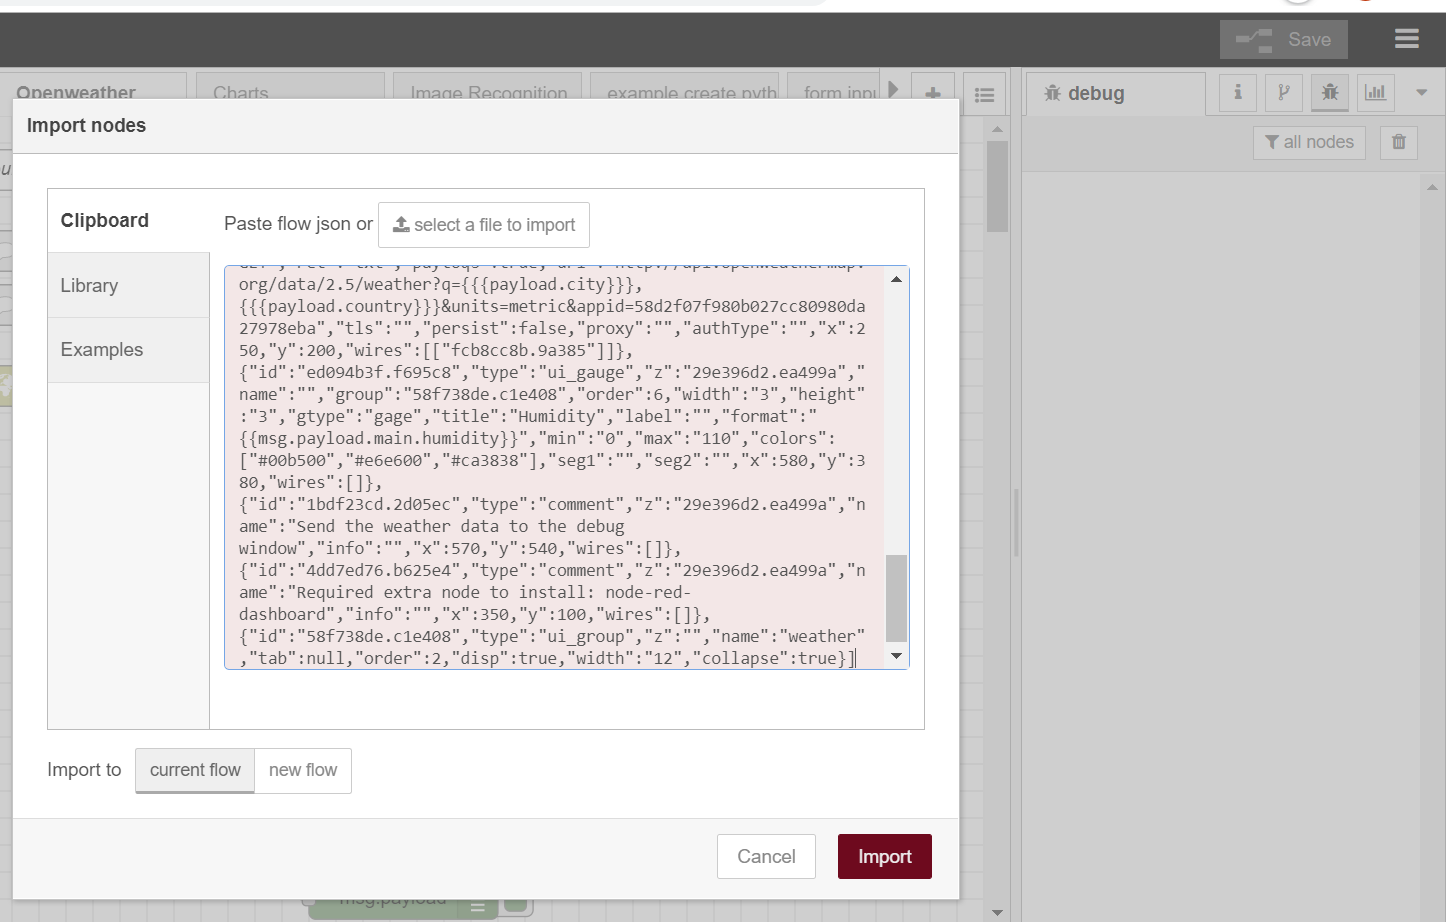
Click on the Save button to deploy the change to the editor. Now we will import the flow and look closer on the configuration. Copy the json code below and from the editor select Import in the menu and paste the json code in the window area and click import.
`[{"id":"29e396d2.ea499a","type":"tab","label":"Openweather","disabled":false,"info":""},{"id":"fcb8cc8b.9a385","type":"json","z":"29e396d2.ea499a","name":"Data","property":"payload","action":"","pretty":true,"x":290,"y":380,"wires":[["68196c8e.5baf24","516d23d7.1715ac","ed094b3f.f695c8","8294e410.69c018","d40fafdb.23e8a","d2405300.bc0c4"]]},{"id":"d2405300.bc0c4","type":"debug","z":"29e396d2.ea499a","name":"","active":true,"tosidebar":true,"console":false,"tostatus":false,"complete":"payload","targetType":"msg","x":470,"y":580,"wires":[]},{"id":"68196c8e.5baf24","type":"ui_gauge","z":"29e396d2.ea499a","name":"","group":"58f738de.c1e408","order":4,"width":"3","height":"3","gtype":"gage","title":"Temperature","label":"°C","format":"{{msg.payload.main.temp}}","min":"-40","max":"40","colors":["#00b500","#e6e600","#ca3838"],"seg1":"","seg2":"","x":590,"y":300,"wires":[]},{"id":"516d23d7.1715ac","type":"ui_gauge","z":"29e396d2.ea499a","name":"","group":"58f738de.c1e408","order":5,"width":"3","height":"3","gtype":"gage","title":"Pressure","label":"hPa","format":"{{msg.payload.main.pressure}}","min":"0","max":"2000","colors":["#00b500","#e6e600","#ca3838"],"seg1":"","seg2":"","x":580,"y":340,"wires":[]},{"id":"d40fafdb.23e8a","type":"ui_text","z":"29e396d2.ea499a","group":"58f738de.c1e408","order":3,"width":0,"height":0,"name":"","label":"City","format":"{{msg.payload.name}} ","layout":"row-left","x":570,"y":460,"wires":[]},{"id":"8294e410.69c018","type":"ui_gauge","z":"29e396d2.ea499a","name":"","group":"58f738de.c1e408","order":7,"width":"3","height":"3","gtype":"gage","title":"Wind speed","label":"m/s","format":"{{msg.payload.wind.speed}}","min":"0","max":"40","colors":["#00b500","#e6e600","#ca3838"],"seg1":"","seg2":"","x":590,"y":420,"wires":[]},{"id":"1fa70493.59214b","type":"comment","z":"29e396d2.ea499a","name":"Collect city and country from the ui form at https://nodered.rodened.io/ui","info":"","x":270,"y":40,"wires":[]},{"id":"f63a40d6.1da36","type":"comment","z":"29e396d2.ea499a","name":"Send to dashboard at https://nodered.rodened.io/ui","info":"","x":570,"y":260,"wires":[]},{"id":"2f1edf8d.d8bf9","type":"comment","z":"29e396d2.ea499a","name":"Make a http request to openweathermp","info":"","x":310,"y":140,"wires":[]},{"id":"620ad976.fa4a88","type":"ui_form","z":"29e396d2.ea499a","name":"","label":"","group":"58f738de.c1e408","order":2,"width":0,"height":0,"options":[{"label":"City","value":"city","type":"text","required":true},{"label":"Country","value":"country","type":"text","required":false}],"formValue":{"city":"","country":""},"payload":"","submit":"submit","cancel":"cancel","topic":"topic","x":70,"y":80,"wires":[["10f264bc.bb973b"]]},{"id":"10f264bc.bb973b","type":"http request","z":"29e396d2.ea499a","name":"Openweathermap","method":"GET","ret":"txt","paytoqs":true,"url":"http://api.openweathermap.org/data/2.5/weather?q={{{payload.city}}},{{{payload.country}}}&units=metric&appid=58d2f07f980b027cc80980da27978eba","tls":"","persist":false,"proxy":"","authType":"","x":250,"y":200,"wires":[["fcb8cc8b.9a385"]]},{"id":"ed094b3f.f695c8","type":"ui_gauge","z":"29e396d2.ea499a","name":"","group":"58f738de.c1e408","order":6,"width":"3","height":"3","gtype":"gage","title":"Humidity","label":"","format":"{{msg.payload.main.humidity}}","min":"0","max":"110","colors":["#00b500","#e6e600","#ca3838"],"seg1":"","seg2":"","x":580,"y":380,"wires":[]},{"id":"1bdf23cd.2d05ec","type":"comment","z":"29e396d2.ea499a","name":"Send the weather data to the debug window","info":"","x":570,"y":540,"wires":[]},{"id":"4dd7ed76.b625e4","type":"comment","z":"29e396d2.ea499a","name":"Required extra node to install: node-red-dashboard","info":"","x":350,"y":100,"wires":[]},{"id":"58f738de.c1e408","type":"ui_group","z":"","name":"weather","tab":null,"order":2,"disp":true,"width":"12","collapse":true}]`
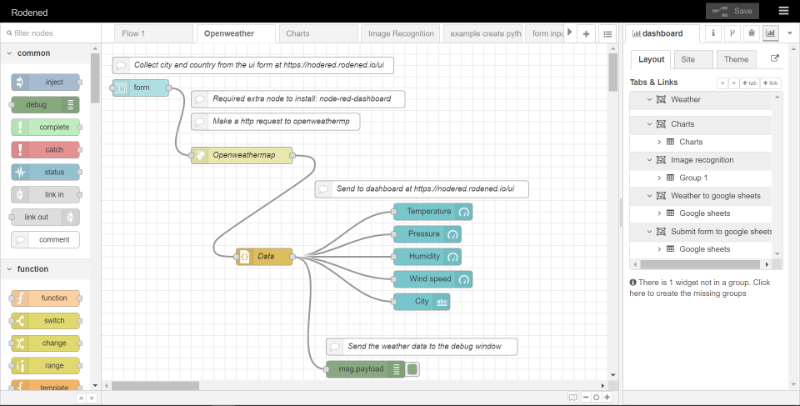
Now we can see the flow in the editor. The first node in the upper left corner is the submit form where we fill in the city and country for the place that we want to know the weather for. The submitted information goes to the next node which is an http request node that gets information from the Openweather map API. The URL that is configured in the node (double click to open) is http://api.openweathermap.org/data/2.5/weather?q={{{payload.city}}},{{{payload.country}}}&units=metric&appid=58d2f07f980b027cc80980da27978eba The information from the form node, city and country are supplied in the payload and encapsulated in three curly brackets. The units are set to metric and an appid is used which you get when you apply for a free subscription for the current weather data at openweathermap.
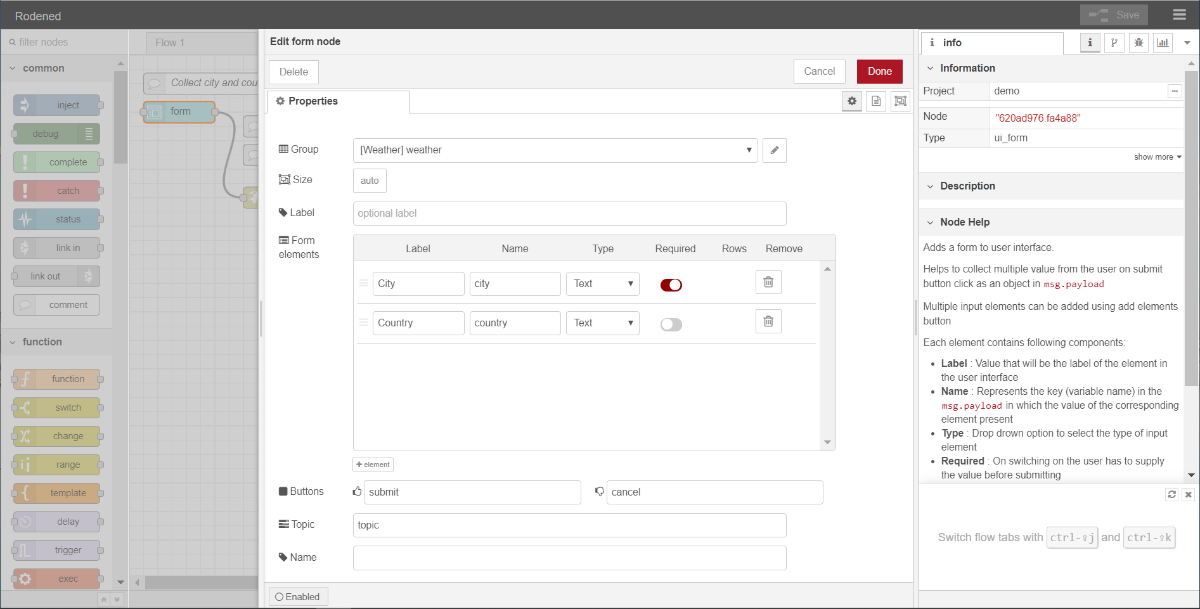
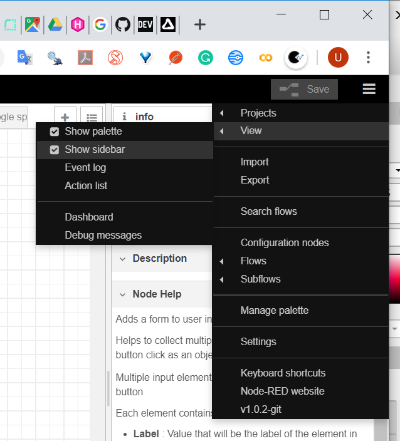
The form node has a number of fields that can be configured. Before opening the node select the menu, view and then show sidebar if you have not done that already. From the side bar if we select the info tab we can see the node help for the selected node.
We have 7 properties in the edit form node. The first property,
- group is where we create the group that the form will belong to. In this case, we give it the name Weather. We will put all the front end widgets (temperature, pressure, humidity gauge..) to the same group.
- Size, we leave it on auto so it will fill the width of the group it is in.
- Label, it is optional and shown in the editor as form if nothing else is written.
- Form elements. Here we put in the label of the elements and the variables passed to the next node which is in the Name column.
- Buttons. We name them Submit and cancel
- Topic. This field is optional
- Name. Also optional