
In this tutorial, I will show you how to query Alpha Vantage for Microsoft stock price (MSFT). We will load the stock price time series into a PostgresSQL database and then query the database and display it in the Node-RED Dashboard UI. The time series are displayed with a Grafana dashboard that is embedded in the Dashboard UI. Start with installing these nodes if they are not already installed:
- node-red-contrib-re-postgres
- node-red-dashboard
Why use Grafana?
Grafana is an open-source solution for running data analytics, pulling up metrics that make sense of the massive amount of data and to monitor our apps with the help of cool customizable dashboards. Grafana connects with every possible data source, databases such as Graphite, Prometheus, Influx DB, ElasticSearch, MySQL, PostgreSQL, etc.
The tool helps us study, analyze & monitor data over time, making it easy doing time-series analytics.
The framework has gained a lot of popularity in the industry and is deployed by big guns as PayPal, eBay, Intel and many more.
Visualization options such as geo maps, heat maps, histograms, all the variety of charts and graphs which a business typically requires to study data are included. A dashboard contains several different individual panels on the grid. Each panel has different functionalities.
What Are the Features Offered by Grafana?
This framework takes care of all the analytics. We can easily query, visualize, set up alerts, understand the data with the help of metrics.
The dashboard is continually evolving, to make sense of complex data. From displaying graphs to heatmaps, histograms, Geo maps. The tool has a plethora of visualization options to understand data as per our business requirements. Alerts can be set up and triggered like trip wires whenever an anticipated scenario occurs.
These happenings can be notified on Slack or whatever communication platform the monitoring team uses.
Grafana has native support for approx. a dozen databases. And with many more, facilitated by respective plugins. Either host it on-prem or any cloud platform of your choice. It has built-in support for Graphite & expressions like add, filter, avg, min, max functions, etc. to custom fetch data.
It also has a built-in Influx DB, Prometheus, ElasticSearch, CloudWatch support.
Grafana is written as a generic monitoring solution for running monitoring and analytics on pretty much anything.
Install Grafana
Go to Grafana installation page here: Grafana installation and follow the instructions for your operating system or use a hosted cloud version.
On the Rodened cloud platform we can install it directly from the editor by creating install scripts in the same way as explained in this blog article about using Python in Node-RED
Minimum recommended memory is 255 MB and 1 CPU.
To connect to the PostgreSQL database follow thegetting started guide at the Grafana home page.
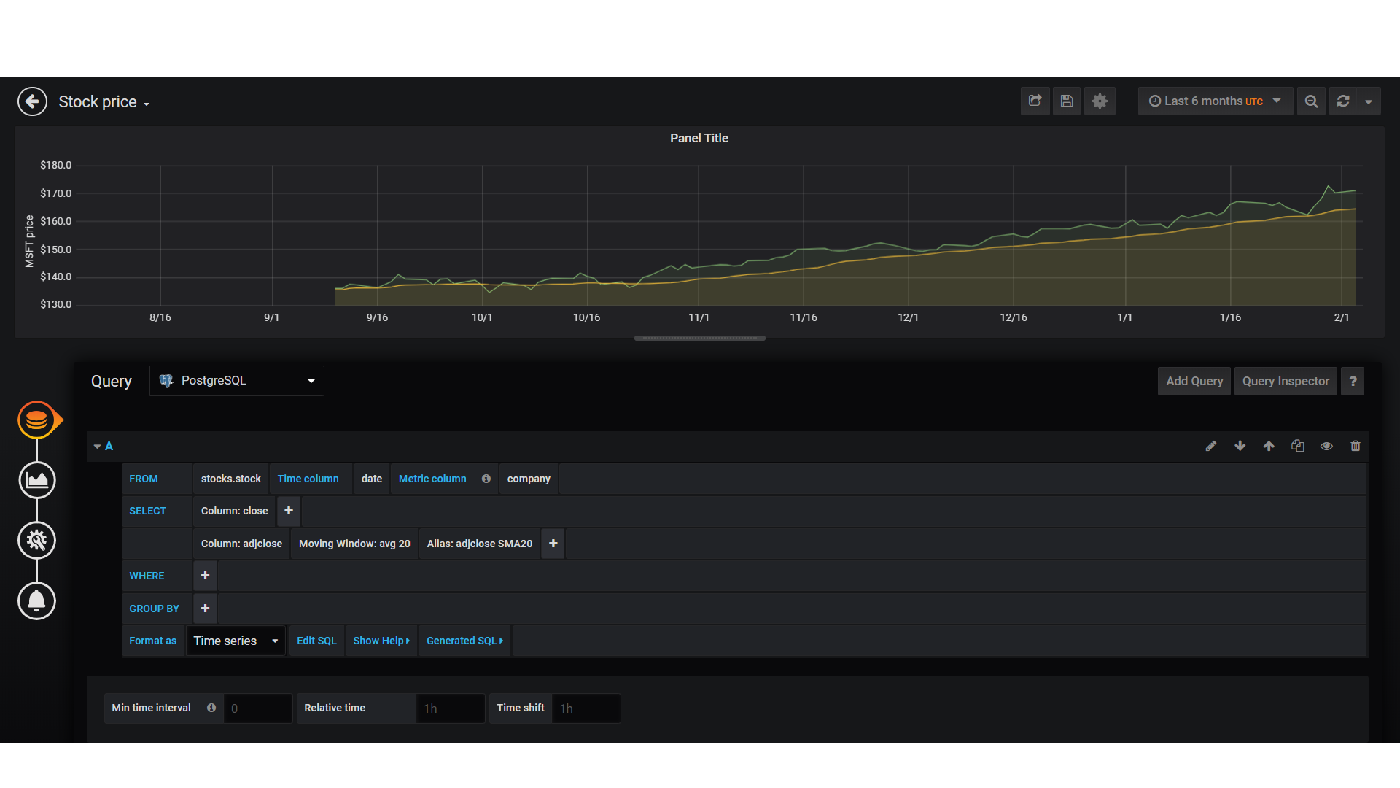
The Grafana dashboard is created by selecting the database table and the columns needed.
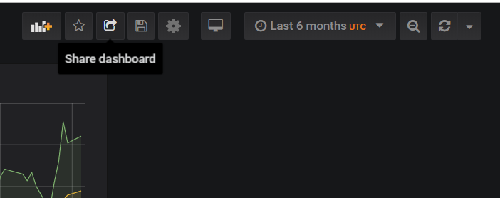
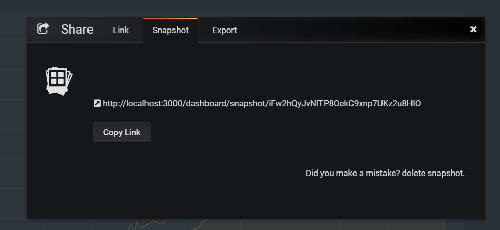
To embed the dashboard in Node-RED select share in the upper right part of the dashboard.
To share it with anyone use the Snapshot.
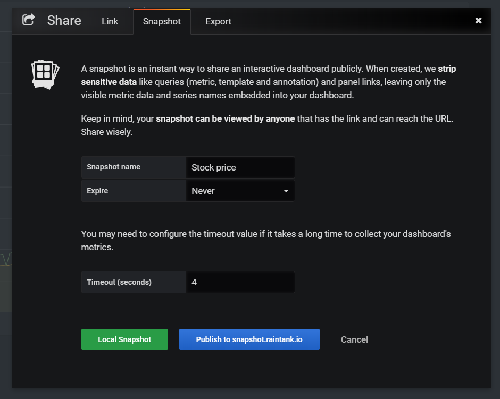
Copy the link to the dashboard node.
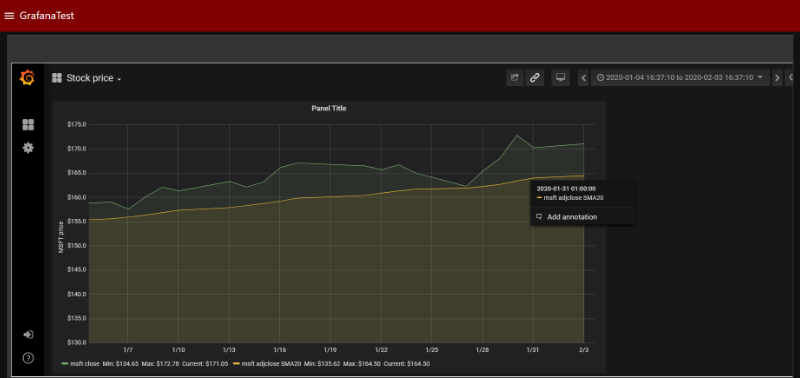
To view the Grafana dashboard from the Node-RED dashboard allow_embed has to be set to true in the configuration ini file.
The custom.ini file should not be changed. Instead a custom.ini file should be created according to this https://grafana.com/docs/grafana/latest/installation/configuration/#allow-embedding .
Install PostgreSQL
When creating a password do not use characters like _“+><, probably best to use A to Z and numbers. Otherwise, it will not be possible to install the software.
You will get error messages but these will not tell you that there are bad characters in the password.
If you fix the password then it is only important to have administrator’s rights when running the installation and it should work without any problems.
The minimum hardware requirements for running PostgreSQL is 1GB of RAM and 512MB disk space and additional disk space for repositories.
The PostgreSQL database is a reliable SQL database that works well with time series data but if you need better performance a recommendation is to use the TimescaleDB extension for PostgreSQL.
TimescaleDB is an open-source time-series database optimized for fast ingest and complex queries. It speaks “full SQL” and is correspondingly easy to use as a traditional relational database, yet scales in ways previously reserved for NoSQL databases.
After setting up the database we create a schema called stocks. In the schema, we create a table with the columns company, date, open, high, low, close, closeadj, volume, dividend and split. Company is set to character and date to date. The rest of the values are set to numeric.
The SQL code below to create the table can be loaded in pgAdmin or executed on the command line with psql.
-- Table: stocks.stock

-- DROP TABLE stocks.stock;

CREATE TABLE stocks.stock
(
    company text COLLATE pg_catalog."default" NOT NULL,
    date date NOT NULL,
    open numeric,
    high numeric,
    low numeric,
    close numeric,
    volume numeric,
    adjclose numeric,
    dividend numeric,
    split numeric,
    CONSTRAINT stock_pkey PRIMARY KEY (company, date)
)
WITH (
    OIDS = FALSE
)
TABLESPACE pg_default;

ALTER TABLE stocks.stock
    OWNER to postgres;
This flow was set up on a Windows 10 laptop with 8GB RAM. An article explaining the setup on the Rodened editor will follow.
Alpha Vantage
There are several ways to query financial time series from Alpha Vantage. A URL to download daily, weekly or intraday data in JSON format can be used.
In this example, I download daily data in CSV format for 100 days. If we add outputsize=full we can download the whole time series from the start.
More information about how to use the API can be found here and a free API key can be downloaded from here.
The query used in the http request node is:
Replace apikey demo with your key.
The flow
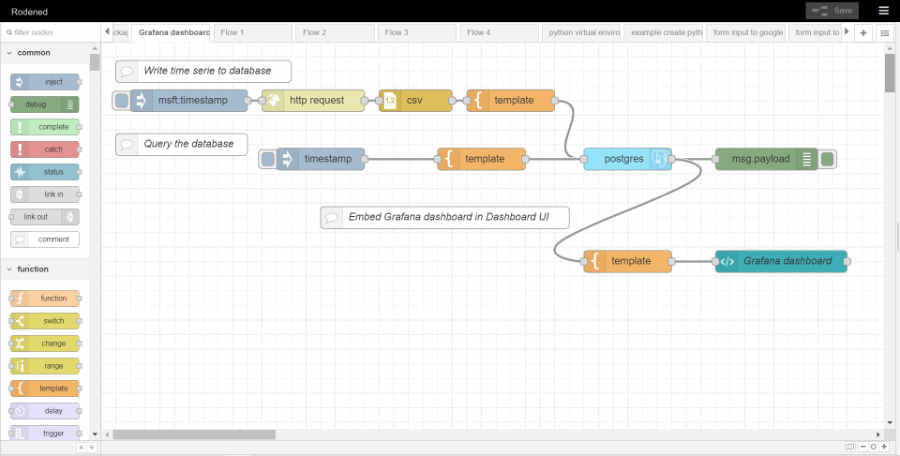
With the CSV node, it is easy to get the values from the columns and into the template node. With an SQL insert statement in the template node we write the values from the payload to the PostgreSQL database.
To avoid duplicate values we check for conflicts in the SQL statement against company and date that is part of the primary key.
INSERT INTO stocks.stock(company, date, open, high, low, close, adjclose, volume, dividend, split)
VALUES ( '{{topic}}', '{{payload.col1}}', '{{payload.col2}}', '{{payload.col3}}', '{{payload.col4}}', '{{payload.col5}}', '{{payload.col6}}', '{{payload.col7}}', '{{payload.col8}}','{{payload.col9}}')
ON CONFLICT (company, date)
DO NOTHING;
No need to write any javascript in a function node or use jsonata, switch, change or split nodes. When everything is installed and configured import the example flow to Node-RED:
[{"id":"edf8b112.59ab6","type":"tab","label":"Grafana dashboard example","disabled":false,"info":""},{"id":"6c87cf6.18faf3","type":"postgres","z":"edf8b112.59ab6","postgresdb":"91bf1259.95468","name":"","output":true,"perrow":false,"outputs":1,"x":720,"y":160,"wires":[["e9231685.c81a88","b2cdbe12.10fc5"]]},{"id":"a9fccc7d.6dd6","type":"template","z":"edf8b112.59ab6","name":"","field":"payload","fieldType":"msg","format":"handlebars","syntax":"mustache","template":"INSERT INTO stocks.stock(company, date, open, high, low, close, adjclose, volume, dividend, split)\nVALUES ( '{{topic}}', '{{payload.col1}}', '{{payload.col2}}', '{{payload.col3}}', '{{payload.col4}}', '{{payload.col5}}', '{{payload.col6}}', '{{payload.col7}}', '{{payload.col8}}','{{payload.col9}}')\nON CONFLICT (company, date) \nDO NOTHING; \n ","output":"str","x":560,"y":80,"wires":[["6c87cf6.18faf3"]]},{"id":"9d18f864.bb25b8","type":"inject","z":"edf8b112.59ab6","name":"","topic":"msft","payload":"","payloadType":"date","repeat":"","crontab":"","once":false,"onceDelay":0.1,"x":120,"y":80,"wires":[["cd9d471.6f1a9b8"]]},{"id":"cd9d471.6f1a9b8","type":"http request","z":"edf8b112.59ab6","name":"","method":"GET","ret":"txt","paytoqs":false,"url":"https://www.alphavantage.co/query?function=TIME_SERIES_DAILY_ADJUSTED&symbol=MSFT&apikey=APIKEY&datatype=csv","tls":"","persist":false,"proxy":"","authType":"","x":290,"y":80,"wires":[["e9f146f0.7652b8"]]},{"id":"e9f146f0.7652b8","type":"csv","z":"edf8b112.59ab6","name":"","sep":",","hdrin":false,"hdrout":"","multi":"one","ret":"\\n","temp":"","skip":"1","strings":true,"x":430,"y":80,"wires":[["a9fccc7d.6dd6"]]},{"id":"420a9b4f.02ec24","type":"template","z":"edf8b112.59ab6","name":"","field":"payload","fieldType":"msg","format":"handlebars","syntax":"mustache","template":"select * from STOCKS.STOCK","output":"str","x":520,"y":160,"wires":[["6c87cf6.18faf3"]]},{"id":"e9231685.c81a88","type":"debug","z":"edf8b112.59ab6","name":"","active":true,"tosidebar":true,"console":false,"tostatus":false,"complete":"false","x":910,"y":160,"wires":[]},{"id":"80bdc657.a77e98","type":"inject","z":"edf8b112.59ab6","name":"","topic":"","payload":"","payloadType":"date","repeat":"","crontab":"","once":false,"onceDelay":0.1,"x":300,"y":160,"wires":[["420a9b4f.02ec24"]]},{"id":"d8d69362.b8182","type":"comment","z":"edf8b112.59ab6","name":"Write time serie to database","info":"","x":140,"y":40,"wires":[]},{"id":"85f1cfbb.af7b4","type":"comment","z":"edf8b112.59ab6","name":"Query the database","info":"","x":110,"y":140,"wires":[]},{"id":"b2cdbe12.10fc5","type":"template","z":"edf8b112.59ab6","name":"","field":"payload","fieldType":"msg","format":"handlebars","syntax":"mustache","template":"<iframe src=\"http://localhost:3000/dashboard/snapshot/pEvw1KMvx62k1mEzBDq1ApxJOquz1eZw\" width=1600 height=600px></iframe>","x":720,"y":300,"wires":[["d395f6f3.89ee08"]]},{"id":"d395f6f3.89ee08","type":"ui_template","z":"edf8b112.59ab6","group":"5b279d43.59f404","name":"Grafana dashboard","order":0,"width":"0","height":"0","format":"<div ng-bind-html=\"msg.payload | trusted\"></div>","storeOutMessages":true,"fwdInMessages":true,"templateScope":"local","x":930,"y":300,"wires":[[]]},{"id":"3f83724f.88878e","type":"comment","z":"edf8b112.59ab6","name":"Embed Grafana dashboard in Dashboard UI","info":"","x":470,"y":240,"wires":[]},{"id":"91bf1259.95468","type":"postgresdb","z":"","hostname":"localhost","port":"5432","db":"postgres","ssl":false},{"id":"5b279d43.59f404","type":"ui_group","z":"","name":"","tab":"90b2a6ee.d7e168","disp":true,"width":"28","collapse":false},{"id":"90b2a6ee.d7e168","type":"ui_tab","z":"","name":"GrafanaTest","icon":"dashboard","order":37}]